Tuesday 02February2016 - Bonds and Stocks Diverging!
Clips from Danielle Park's excellent blog.
High yield prices began to plunge in late 2006 as the subprime bomb blew. Stocks joined the descent late 2007 to early 2009. By the bottom, high yield bonds had lost an average of 38% and the S&P 500 55%. Both then rallied two years, before slumping afresh with global revenues in mid 2011, and rallying into 2013 on QE ‘liquidity’. That was then.
Since 2013, high yield bonds have been diving (down some 18% so far) even as the S&P 500 managed to limp higher into mid-2015 on ‘FANG’ fumes (Facebook, Amazon, Netflix and Google).
High yield bonds broke below their 2011 support line last fall (horizontal green band above) and so far continue to drop as 2016 brings rising defaults and write-downs.
Click image to enlarge.
Tuesday, 2 February 2016
Saturday, 30 January 2016
Saturday 30January2016 - When Will Reality Kick in?
Clips from Danielle Park's blog.
Sales and profit trends reveal hideous S&P 500
An aging and indebted world spending less, and a soaring greenback, have taken both boots to multinational sales and earnings trends since 2011. While stock prices always recognize such realities eventually, this cycle central banks have managed to inspire an unusually long period of willful blindness among participants.
Down just 11% since last July, the S&P 500 has levitated in a world of HFT dreaming even as other global markets have increasingly hit the skids. Far from getting off easy however, the S&P 500 now has the distinction of being one of the most precariously perched markets in the world today. This chart of sales growth (in blue) versus the price of the S&P (in black) since 2000 paints the picture well.
Sunday, 17 January 2016
Sunday 17January2016 - The Crumbling Financial Edge!
From Mauldin's weekly newsletter.
George Friedman comments on Italy's failing banks. Will an Italian bank holiday be the event that kicks off the next world financial crisis?
Friedman: Italian Debt Crumbles
Now let’s turn to geopolitical concerns for a moment. All my readers have had a chance to look at George Friedman’s 2016 forecast. New readers can access a summary for free here and find a link to the full version. I can’t tell you how thrilled I am that George has partnered with Mauldin Economics. He brings so much to our table with his insights. Rather than go over what you have hopefully already read (and if you haven’t, you should), let me highlight one position he has clarified further since he wrote that forecast.
In a note entitled “The Precarious State of Italian Banks,” George and his team gave us an update on the serious financial problems facing Italy. You can find good news, but the bad news overwhelms the good. Nonperforming loans have now reached $216 billion, which is about 17% of Italian GDP. We have already seen some Italian banks fail rather spectacularly, and we are going to see that number increase. There is never just one cockroach. And while depositors are covered up to €100,000, that doesn’t do much good for businesses and wealthier households.
Italian bank debt is now very suspect. As it happens, Italians, rather than depositing their money in the bank at very little or no interest, buy bank bonds to get at least some return. In the recent spate of bank closings, 130,000 shareholders lost €790 million. The four small banks that failed represented just 1% of total Italian bank deposits. The total amount of bank debt held by Italian households is €237.5 billion. That’s billion with a B. Think of it as high-yield debt on steroids – except that it is generally very low-yield.
It’s not clear whether the Italian insurance deposit scheme has the money to cover even a fraction of the bigger potential losses. The ratio of assets to deposits covered is about 250 to 1. Now, the US FDIC’s required ratio is about 100 to 1, but US banks don’t have nonperforming loans of 17.9%, either.
There’s a lot more to this story than my brief summary can detail, but the point is that the problems in Europe don’t stop with the immigration crisis. The credit crisis of a few years ago has not gone away. Italy’s debt-to-GDP is growing every year, and it was already at a critical level five years ago – before the ECB took rates into negative territory and bought massive quantities of Italian bonds. They can continue to do that, but can they buy Italian deposits and defaulted bank debt? That’s rather doubtful. This is a story we will be watching closely as it unfolds this year.
From Mauldin's weekly newsletter.
George Friedman comments on Italy's failing banks. Will an Italian bank holiday be the event that kicks off the next world financial crisis?
Friedman: Italian Debt Crumbles
Now let’s turn to geopolitical concerns for a moment. All my readers have had a chance to look at George Friedman’s 2016 forecast. New readers can access a summary for free here and find a link to the full version. I can’t tell you how thrilled I am that George has partnered with Mauldin Economics. He brings so much to our table with his insights. Rather than go over what you have hopefully already read (and if you haven’t, you should), let me highlight one position he has clarified further since he wrote that forecast.
In a note entitled “The Precarious State of Italian Banks,” George and his team gave us an update on the serious financial problems facing Italy. You can find good news, but the bad news overwhelms the good. Nonperforming loans have now reached $216 billion, which is about 17% of Italian GDP. We have already seen some Italian banks fail rather spectacularly, and we are going to see that number increase. There is never just one cockroach. And while depositors are covered up to €100,000, that doesn’t do much good for businesses and wealthier households.
Italian bank debt is now very suspect. As it happens, Italians, rather than depositing their money in the bank at very little or no interest, buy bank bonds to get at least some return. In the recent spate of bank closings, 130,000 shareholders lost €790 million. The four small banks that failed represented just 1% of total Italian bank deposits. The total amount of bank debt held by Italian households is €237.5 billion. That’s billion with a B. Think of it as high-yield debt on steroids – except that it is generally very low-yield.
It’s not clear whether the Italian insurance deposit scheme has the money to cover even a fraction of the bigger potential losses. The ratio of assets to deposits covered is about 250 to 1. Now, the US FDIC’s required ratio is about 100 to 1, but US banks don’t have nonperforming loans of 17.9%, either.
There’s a lot more to this story than my brief summary can detail, but the point is that the problems in Europe don’t stop with the immigration crisis. The credit crisis of a few years ago has not gone away. Italy’s debt-to-GDP is growing every year, and it was already at a critical level five years ago – before the ECB took rates into negative territory and bought massive quantities of Italian bonds. They can continue to do that, but can they buy Italian deposits and defaulted bank debt? That’s rather doubtful. This is a story we will be watching closely as it unfolds this year.
Thursday, 14 January 2016
Thursday 14January2016 - Alberta Bitumen Oil Below $10
Clip from Danielle Park's blog.
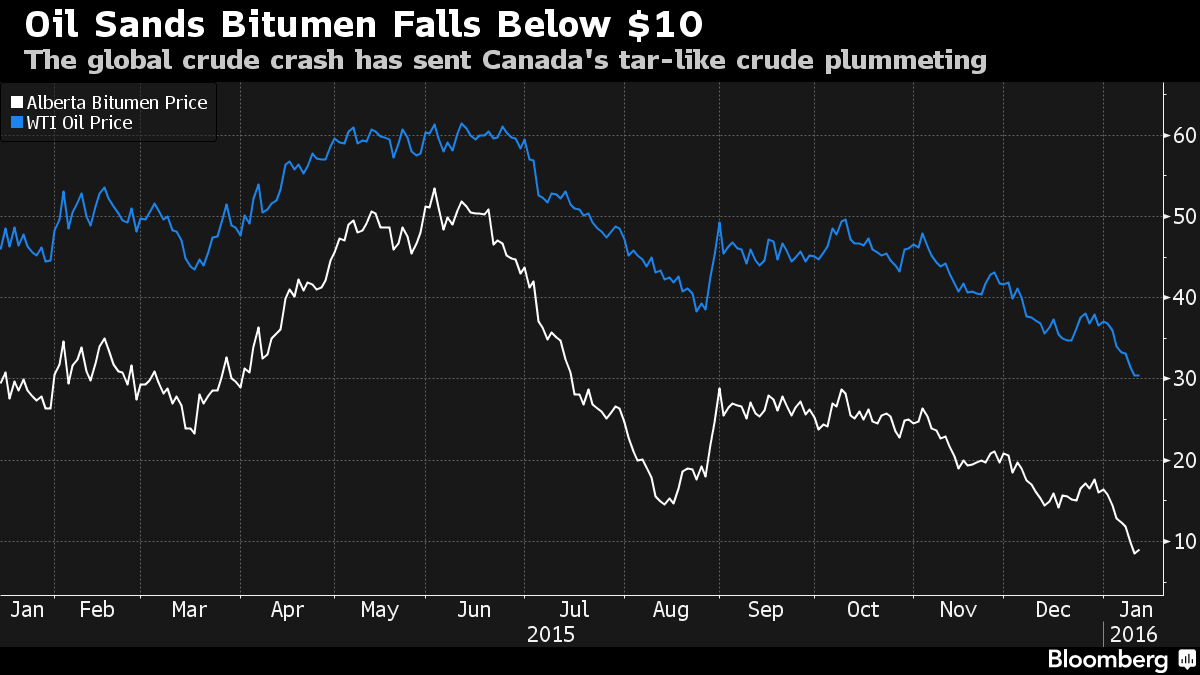
Canadian oil under $10, how low can it go?
Hitting a low of $8.35 a barrel yesterday (down from $80 2 years ago), Canadian oil producers are losing money at current prices. Yet so far, they are continuing to pump at record levels nonetheless. The spending to extract bitumen is front-loaded and so sunk costs encourage producers to increase output as prices fall. Today highly indebted and desperate for cash flow, most don’t see a choice. See: Crude at $10 already a reality
Monday, 11 January 2016
Monday 11January2016 - Canadian Dollar and Stock Market Outlook!
From Danielle Park’s blog. Monday 11January2016
Click image to enlarge.
From Danielle Park’s blog. Monday 11January2016
Posted on January 11, 2016 by Danielle
Park
Canadian dollar index (FXC) broke below .70/U$ this
am as West Texas Crude broke below $32 and copper below $2.00. Canada
can’t catch a break these days.
The TSX is officially into bear market territory,
now down more than 20% from the cycle peak in September 2014 and falling…
Closing below 12,700 (dotted line below) last week, the next key test is the
11,000 area (brown bar below) which was the dot.com peak in September 2000, as
well as support that held through the QE-led exuberance of late 2009 to late
2012.
If the 11,000 support area fails once more, we will
be watching for a test of the 2009 uptrend (yellow bar) in the 10,000
area. Ultimately, history suggests that if the present downturn is to be
the third and final cyclical bear to end the secular bear that began for stocks
from extreme over-valuations in 2000, then a retest of the March 2009 lows
(green bar) in the 8,000 level is in the cards for the TSX composite.
The Canadian dollar (red below) typically leads the
Canadian stock market (TSX in blue since 1999), and it’s already below the 2009
low as shown here.
At Venable Park, we have long suspected
that at least one more test of the 2009 lows was probable before this secular
bear could end. Time will tell if that thesis was correct. One
thing for sure, few financial managers have told their clients or investors
that this is a probability.
Click image to enlarge.
Subscribe to:
Posts (Atom)